Data Presentation - Pie Charts
A pie chart is a type of graph in which a circle is divided into sectors that each represents a proportion of the whole. Pie charts are a useful way to organize data in order to see the size of components relative to the whole, and are particularly good at showing percentage or proportional data. While pie charts are popular data representations, they can be hard to read, and it can be difficult to compare data from one pie chart to another. Pie charts are a useful way to visualize information that might be presented in a small table.
 source: ers.usda.gov
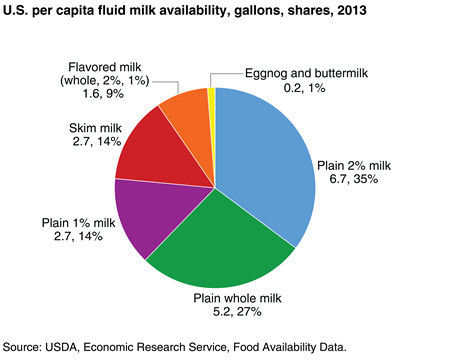
The pie chart above shows the distribution of fluid milk in the U.S. in 2013.
Note: the percentages in the names of the milk, "plain 1% milk," "plain 2% milk," etc. indicate different types of milk.
The entire circle encompasses all of the fluid milk, and the sectors represent specific products that use a percentage of that milk. For example, 35% of fluid milk was used in plain 2% milk, and 1% of fluid milk was used in eggnog and buttermilk.
This milk data is well represented in a pie chart since there are a small number of categories (types of milk) that can be modeled as a portion of a whole (total amount of milk).
Say the pie chart above represents the breakdown of 100 gallons of milk. Create a 2-column table that lists the type of milk in the first column and the number of gallons of each type of milk in the second column.
Type of Milk Number of Gallons Plain 2% 35 Plain 1% 14 Skim 14 Plain Whole 27 Flavored 9 Eggnog and Buttermilk 1 If there are 100 gallons of milk, and 27% of that milk is whole milk, then 27 gallons is whole milk. If 14% of the milk is skim milk, 14 percent of 100 gallons is 14 gallons, and so on.
Contents
Making a Pie Chart
Pie charts are good for showing how the size of one part relates to the whole.
To make a pie chart, separate the data into components. In the pie chart above, the data is about all fluid milk in the U.S., and the categories are plain 2% milk, plain whole milk, plain 1% milk, skim milk, flavored milk, and eggnog and buttermilk. Next, determine the ratio or percentage that each component takes up out of the whole. The total sum of percentages should sum to 100%. Divide the circle into proportional sectors. If a particular component made up 25% of the whole, a quarter of the circle would represent that component. Color is often used to differentiate sectors.
Good practices for making pie charts:
- Title the chart.
- Use labels to denote categories.
- If ratios are unclear, label sectors with the percentages they represent.
- Use different colors for each sector. Don't repeat colors.
- Use accurate sizing when making sectors. For example, a sector representing 50% of the whole should take up exactly half of the circle.
- Make sure that the number of slices is small enough that the reader can make sense of the chart.
What is wrong with this pie chart?
source: wikipedia
This pie chart has too many sectors. It is hard to see how sectors compare with one another.
What could be improved about this pie chart?
This pie chart describes the distribution of native English speakers by country.
source: wikipedia
This pie chart could benefit from a descriptive title, and it might be helpful to include labels for the percentages of each sector as the “Canada,” “Other,” and “Australia” sectors look roughly the same size.
What food group has about the same daily calories per capita as grain products?
 source: ers.usda.gov