Data Presentation - Stem-leaf plot
Stem and leaf plots are used to display quantitative data (i.e. numbers) for small data sets of no more than \(40\) or \(50\) points. They display the exact values of each data point. These plots are useful for visualizing frequency distributions in data sets.
Making a Stem and Leaf Plot
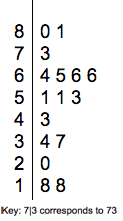
The structure of a stem and leaf plot is as follows: on the left side of a bar, display the “stem” values, and on the right side of the bar, display the “leaf” values. A key is included to indicate how to interpret the stem and leaf values. For example, in the stem and leaf plot below, \(7|1\) corresponds to \(71\). This means that the stems represent the \(10\)’s place. A \(2\) in the stem column represents \(20\), and a \(4\) in the stem column represents \(40\). The leaves in this example represent the \(1\)’s place, so a \(9\) in the leaf column represents a \(9\). Putting stem and leaf values together goes as follows: if a \(3\) in the stem column and a \(2\) in the leaf column are in the same row, this evaluates to \(32\). Sometimes, there are multiple numbers in a row in the leaf column, for example, \(8| 0 1\) is the top row of the stem and leaf plot below. This row specifies two values: \(80\) and \(81\).

Create a list of the numbers that are in the stem and leaf plot above.
Answer:
\([18,18,20,34,37,43,51,51,53,64,65,66,66,73,80,81]\)
The stem and leaf plot below represents the scores on an exam. Determine the minimum score, the maximum score, and the median score from looking at the plot.

Answer:
To find the minimum score, locate the smallest value on the plot. This is the first value in the lowest row of the plot. Since there are no values in the \(0\) or \(1\) row, the lowest value is found in the \(2\) row and is \(25\)%. To find the maximum score, do a similar investigation except look for the largest value in the topmost row that has values. In this case, the maximum score is \(97\)%. To find the median value, locate the middlemost score. You can do this by making a list of all of the values and finding the middle, or by locating the middle value on the stem and leaf plot. To do this, count up from the bottom and down from the top until you find the middle value. The median score is \(75\)%.
The stem and leaf plot below shows the numbers of points a basketball player scored during a series of games.

On average, how many points did the player score per game?
Construct a stem and leaf plot from the following list of numbers \([1,14,16,23,23,29,35,44,50,67,67,70,78]\).
Answer:
