Linear Regression
Linear regression is a technique used to model the relationships between observed variables. The idea behind simple linear regression is to "fit" the observations of two variables into a linear relationship between them. Graphically, the task is to draw the line that is "best-fitting" or "closest" to the points \( (x_i,y_i),\) where \( x_i\) and \(y_i\) are observations of the two variables which are expected to depend linearly on each other.
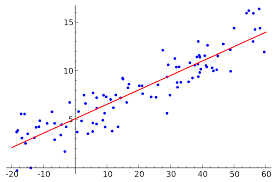 The best-fitting linear relationship between the variables \(x\) and \(y\). [1]
Regression is a common process used in many applications of statistics in the real world. There are two main types of applications:
Predictions: After a series of observations of variables, regression analysis gives a statistical model for the relationship between the variables. This model can be used to generate predictions: given two variables \(x\) and \(y,\) the model can predict values of \(y\) given future observations of \(x.\) This idea is used to predict variables in countless situations, e.g. the outcome of political elections, the behavior of the stock market, or the performance of a professional athlete.
Correlation: The model given by a regression analysis will often fit some kinds of data better than others. This can be used to analyze correlations between variables and to refine a statistical model to incorporate further inputs: if the model describes certain subsets of the data points very well, but is a poor predictor for other data points, it can be instructive to examine the differences between the different types of data points for a possible explanation. This type of application is common in scientific tests, e.g. of the effects of a proposed drug on the patients in a controlled study.
Although many measures of best fit are possible, for most applications the best-fitting line is found using the method of least squares. That is, viewing \( y\) as a linear function of \(x,\) the method finds the linear function \(L\) which minimizes the sum of the squares of the errors in the approximations of the \( y_i\) by \( L(x_i).\)
Contents
Method of Least Squares
Here is an example to illustrate the process.
Find the best-fitting line for the data points \( (1,2),\) \((2,3),\) \((4,7),\) \((5,5),\) \((7,11).\)
To find the line \(y=mx+b\) of best fit through these five points, the goal is to minimize the sum of the squares of the differences between the \(y\)-coordinates and the predicted \(y\)-coordinates based on the line and the \(x\)-coordinates. This is \[ (1m+b-2)^2 + (2m+b-3)^2 + (4m+b-7)^2 + (5m+b-5)^2 + (7m+b-11)^2. \] This is a quadratic polynomial in \( m\) and \( b,\) and is minimized by taking partial derivatives with respect to \(m,\) using the chain rule, and setting them equal to \( 0.\) This gives \[ \begin{align} 2(1m+b-2)+4(2m+b-3)+8(4m+b-7)+10(5m+b-5)+14(7m+b-11) &= 0 \\ (1m+b-2)+2(2m+b-3)+4(4m+b-7)+5(5m+b-5)+7(7m+b-11)&= 0, \end{align} \] which reduces to \[ \begin{align} 95m+19b &= 138 \\ 19m+5b &= 28, \end{align} \] which has the unique solution \( b=\frac13\) and \(m=\frac{79}{57}.\) So the best-fitting line is \( y=\frac{79}{57}x + \frac13.\) \(_\square\)

Note that it was not necessary to use a line to model the data. For instance, a quadratic curve \(y = ax^2+bx+c,\) with the five points plugged into the expression for the sum of the squares of the errors, and with partial derivatives as in the example, would give three equations in the three unknowns \(a,b,c.\) As long as there are "enough" points, the resulting equations will have a unique solution; see below for a more rigorous discussion of the linear algebra involved in general.
General Formula for the Least-squares Line
The above derivation can be carried out in general: given points \( (x_1,y_1),(x_2,y_2),\ldots,(x_n,y_n),\) the slope and intercept of the least-squares line satisfy the equations
\[ \begin{align} s_2 m + s_1 b &= c_{xy} \\\\ s_1 m + n b &= c_y, \end{align} \]
where \(s_1,s_2,c_{xy},c_y\) are given by the following formulas:
\[ \begin{align} s_1 &= \sum x_i \\\\ s_2 &= \sum x_i^2 \\\\ c_{xy} &= \sum x_iy_i \\\\ c_y &= \sum y_i. \end{align} \]
In the example above, these are
\[ \begin{align} s_1 &= 1+2+4+5+7 \\&= 19\\\\ s_2 &= 1^2+2^2+4^2+5^2+7^2 \\&= 95 \\\\ c_{xy} &= 1\cdot 2 + 2\cdot 3 + 4\cdot 7 + 5 \cdot 5 + 7 \cdot 11 \\&= 138 \\\\ c_y &= 2+3+7+5+11 \\&= 28. \end{align} \]
Solving for \(m\) and \(b\) leads to the equations
\[ \begin{align} m = \frac{n c_{xy} - s_1 c_y}{n s_2 - s_1^2} &= \frac{n \left( \sum x_iy_i \right) - \left( \sum x_i \right) \left( \sum y_i \right)}{n \sum x_i^2 - \left( \sum x_i \right)^2} \\\\ b = \frac{s_2c_y - s_1 c_{xy}}{ns_2 -s_1^2} &= \frac{\left( \sum x_i^2 \right) \left( \sum y_i \right) - \left( \sum x_i \right) \left( \sum x_iy_i \right)}{n \sum x_i^2 - \left(\sum x_i\right)^2} \end{align} \]
for the best-fit line \(y=mx+b.\)
Find the best line to fit the data points \( (1,0), (2,0), \ldots, (9,0), (10,40).\) Use the least squares method: the line should be the one that minimizes the sum of the squares of the errors in the \(y\)-coordinates.
If the line is written as \( y = mx+b,\) where \( m =\frac pq\) with \(p\) and \(q\) being coprime prime positive integers and \( b\) is an integer, find \(p+q+b.\)
Why least squares?
The choice of quantity to minimize when finding a best-fit line is by no means unique. The sum of the errors, or the sum of the absolute values of the errors, often seems more natural. Why is least squares the standard?
One reason is that the equations involved in solving for the best-fit line are straightforward, as can be seen in the above example. Equations involving absolute value functions are more difficult to work with than polynomial equations. Another qualitative reason is that it is generally preferred to penalize a single large error rather than many "medium-sized" errors. But this does not necessarily explain why the exponent \(2\) is preferred to, say, \( 1.5\) or \(3.\)
The most convincing justification of least squares is the following result due to Gauss:
Suppose \(y=f(x).\) We measure values \(x_i,y_i\) and compute errors \(y_i-f(x_i).\) If these errors (e.g. errors made in measurement) are independent and normally distributed, then consider, for any possible linear function \(f,\) the probability \(P_f\) of getting the measurements \( (x_i,y_i)\) if \(y=f(x)\) were the correct model. The least-squares line is the line for which \(P_f\) is maximized.
That is, the least-squares line gives the model that is most likely to be correct, under natural assumptions about sampling errors.
General Regression using Linear Algebra
The following theorem generalizes the least squares process and shows how to find the best-fitting line using matrix algebra:
Suppose \( A\) is an \(m\times n\) matrix, where \(m > n.\) Suppose \(\bf y\) is an \(m \times 1\) column vector. The \(n \times 1\) vector \( \hat{{\bf x}}\) that minimizes \( \|A{\bf x}-{\bf y}\|^2\) equals \( \big(A^TA\big)^{-1}A^T{\bf y}\) \(\big(\)as long as \(A^TA\) has rank \(n\big).\)
This is a standard theorem of linear algebra. The idea is to split \( \bf y\) as a sum of a vector \(\bf v\) in the column space of \(A\) and a vector \(\bf z\) perpendicular to the column space of \(A,\) which is a vector in the null space of \(A^T.\) Then \(A\hat{\bf x} = \bf v\) is solvable, and \(\bf v\) is the projection of \(\bf y\) onto the column space of \(A,\) so it is the vector that minimizes the distance to \(\bf y\) as desired. Now \( \big(A^TA\big)\hat{\bf x} = A^T{\bf v} = A^T{\bf y},\) so the result folows. \(_\square\)
The previous example can be rewritten in matrix language: we seek a least-squares approximation to the equation \[ \begin{pmatrix}1&1\\2&1\\4&1\\5&1\\7&1\end{pmatrix} \begin{pmatrix}m\\b\end{pmatrix}= \begin{pmatrix} 2\\3\\7\\5\\11 \end{pmatrix}. \] This equation has no solutions (since no line goes through all five points), but the least squares solution is given by multiplying both sides by \(A^T\) and solving \[ \begin{align} \begin{pmatrix}1&2&4&5&7\\1&1&1&1&1\end{pmatrix} \begin{pmatrix}1&1\\2&1\\4&1\\5&1\\7&1\end{pmatrix} \begin{pmatrix}m\\b\end{pmatrix} &= \begin{pmatrix}1&2&4&5&7\\1&1&1&1&1\end{pmatrix} \begin{pmatrix} 2\\3\\7\\5\\11 \end{pmatrix} \\ \begin{pmatrix} 95&19\\19&5\end{pmatrix} \begin{pmatrix}m\\b\end{pmatrix} &= \begin{pmatrix}138\\28 \end{pmatrix}, \end{align} \] which is the same system of equations we got by taking partial derivatives, and leads again to the unique solution \(m=\frac{79}{57}\) and \(b=\frac13.\) \(_\square\)
References
- Sewaqu, . Linear regression. Retrieved November 5, 2010, from https://en.wikipedia.org/wiki/Least_squares#/media/File:Linear_regression.svg