Variance
Variance is a statistic that is used to measure deviation in a probability distribution. Deviation is the tendency of outcomes to differ from the expected value.
Studying variance allows one to quantify how much variability is in a probability distribution. Probability distributions that have outcomes that vary wildly will have a large variance. Probability experiments that have outcomes that are close together will have a small variance.
The variance explored on this page is different from sample variance, which is the variance of a sample of data.
Calculating the Variance
If \(X\) is a numerical discrete random variable with distribution \(p(x)\) and expected value \(\mu = \text{E}(X)\), the variance of \(X\), denoted as \(\sigma^2\) or \(\text{Var}[X]\), is
\[ \sigma^2=\text{Var}[X] = \text{E}\big[ (X - \mu)^2\big] = \sum_x (x - \mu)^2 p(x).\]
Note that from the definition, the variance is always non-negative, and if the variance is equal to zero, then the random variable \(X\) takes a single constant value, which is its expected value \(\mu.\)
In the rest of this summary, it is assumed \(X\) is a discrete numerical random variable with distribution \(p(x)\) and expected value \(\mu = E(X).\) The following theorem gives another method to calculate the variance.
The variance of random variable \(X\) is
\[ \text{Var}[X] = \text{E}\big[X^2\big] - \mu^2.\]
By definition,
\[\begin{align} \text{Var}[X] &= \text{E}\big[ (X - \mu)^2\big] \\ &= \text{E} \big[X^2 - 2 \mu X + \mu^2 \big]\\ &= \text{E}\big[X^2\big] - 2 \mu \text{E}[X] + \text{E}\big[\mu^2\big]\\ &= \text{E}\big[X^2\big] - 2\mu \cdot \mu + \mu^2\\ &= \text{E}\big[X^2\big] - \mu^2, \end{align}\]
where the third line follows from linearity of expectation. \(_\square\)
What is the variance of a fair, six-sided die roll?
Let \(X\) be the random variable that represents the result of the die roll. It is known that \(\text{E}[X]=\frac{7}{2}\).
\(\text{E}[X^2]\) is calculated as follows:
\[\text{E}\big[X^2\big]=\sum\limits_{k=1}^6{\dfrac{1}{6}k^2}=\dfrac{1}{6}\times\dfrac{(6)(7)(13)}{6}=\dfrac{91}{6}.\]
Then, the variance can be calculated:
\[\text{Var}[X]=\text{E}\big[X^2\big]-\mu^2=\dfrac{91}{6}-\dfrac{49}{4}=\dfrac{35}{12}\approx 2.917.\ _\square\]
Properties of Variance
The following properties of variance correspond to many of the properties of expected value. However, some of these properties have different results.
For a constant \(c\),
\[\text{Var}[c]=0.\]
We have
\[\begin{align} \text{Var}[c]&=\text{E}\Big[\big(c-E[c]\big)^2\Big] \\ &=\text{E}\big[(c-c)^2\big] \\ &=0.\ _\square \end{align}\]
For random variable \(X\) and any constant \(c\),
\[ \text{Var}[cX] = c^2 \text{Var}[X].\]
By the properties of expectation, \(\text{E}[cX] = c \text{E}[X] = c\mu\). Then,
\[ \begin{align} \text{Var}[cX] &= \text{E}\big[ ( cX - c \mu)^2 \big]\\ &= \text{E}\big[c^2(X- \mu)^2\big]\\ &= c^2 \text{E}\big[(X- \mu)^2\big]\\ &= c^2\text{Var}[X].\ _\square \end{align}\]
For random variable \(X\) and any constant \(c\),
\[ \text{Var}[X + c] = \text{Var}[X] .\]
\[\begin{align} \text{Var}[X + c] &= \text{E}\big[(X+c)^2\big] - (\mu+c)^2\\ &= \text{E}\big[X^2 + 2cX + c^2\big] - \big(\mu^2 + 2 c\mu + c^2\big)\\ &= \text{E}\big[X^2\big] + 2c\text{E}[X] + \big(c^2 - \mu^2 - 2c\mu - c^2\big) \\ &= \text{E}\big[X^2\big] - \mu^2\\ &= \text{Var}[X]. \ _\square \end{align}\]
The above two theorems show how translating or scaling the random variable by a constant changes the variance. The first theorem shows that scaling the values of a random variable by a constant \(c\) scales the variance by \(c^2\). This makes sense intuitively since the variance is defined by a square of differences from the mean. The second theorem shows that translating all variables by a constant does not change the variance. This also makes intuitive sense, since translating all variables by a constant also translates the expected value, and the spread of the translated values around the translated expected value remains unchanged.
From the linearity property of expected value, for any two random variables \(X\) and \(Y\), \(E(X+Y) = E(X) + E(Y).\) However, this does not hold for variance in general. One special case for which this does hold is the following:
Let \(X\) and \(Y\) be independent random variables. Then
\[ \text{Var}(X + Y) = \text{Var}(X) + \text{Var}(Y).\]
We have
\[\begin{align} \text{Var}(X+Y) &= E\big( (X+Y)^2 \big) - \big(E(X +Y)\big)^2\\ &= E( X^2 + 2XY + Y^2 ) - \big(E(X) + E(Y)\big)^2\\ &= E(X^2) + 2E(XY) + E(Y^2) - \big(E(X)^2 + 2E(X)E(Y) + E(Y)^2\big)\\ &= E(X^2) + 2E(X)E(Y) + E(Y^2) - E(X)^2 - 2E(X)E(Y) - E(Y)^2\\ &= E(X^2) - E(X)^2 + E(Y^2) - E(Y)^2\\ &= \text{Var}(X) + \text{Var}(Y), \end{align}\]
where the calculation \(E(XY) = E(X) E(Y)\) in the fourth line follows from the independence of random variables \(X\) and \(Y\). \(_\square\)
The following is a generalization of the above theorem.
Let \(X_1, X_2, \ldots, X_k\) be pairwise independent random variables. Then
\[ \text{Var}(X_1 + X_2 + \cdots + X_k) = \text{Var}(X_1) + \text{Var}(X_2) + \cdots + \text{Var}(X_k).\]
For non-independent random variables \(X\) and \(Y\),
\[ \text{Var}(X + Y) = \text{Var}(X) + \text{Var}(Y) + 2\text{Cov}(X,Y).\]
We have
\[\begin{align} \text{Var}(X+Y) &= \text{Cov}(X+Y, X+Y)\\ &= \text{Cov}(X,X) + \text{Cov}(Y,Y) + 2\text{Cov}(X,Y)\\ &= \text{Var}(X) + \text{Var}(Y) + 2\text{Cov}(X,Y). \end{align}\]
In order to calculate the variance of the sum of dependent random variables, one must take into account covariance.
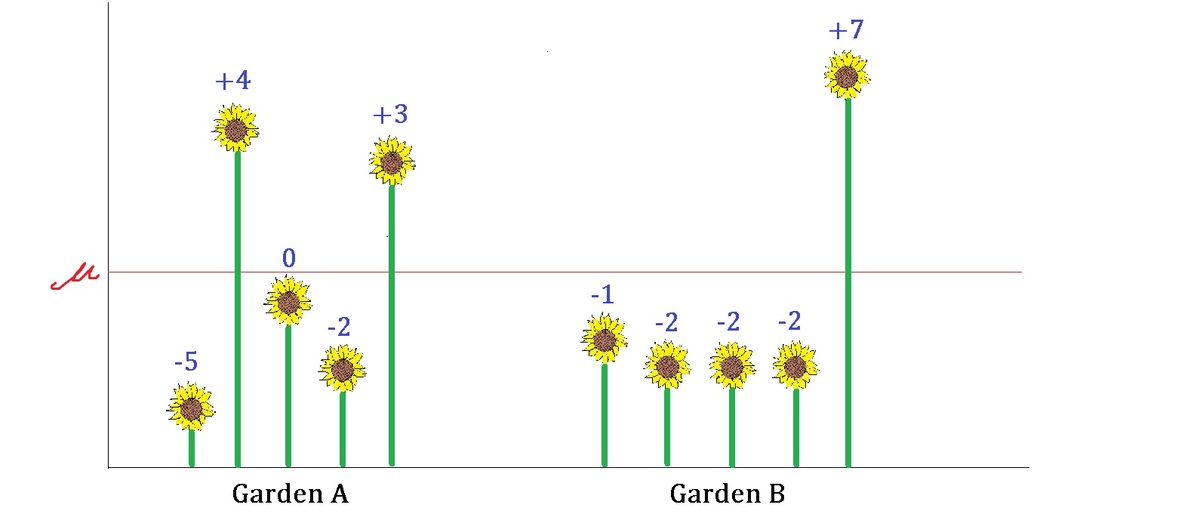
You are planting 5 sunflowers in each of the 2 gardens, where these sets of plants shoot out in varying heights.
Shown above is the graph depicting the height of each sunflower, where the red line indicates the mean height of sunflower population \(\mu\).
For example, the shortest sunflower in Garden A is 5 cm shorter than average while the highest one in Garden B is 7 cm higher than average.
Which set of sunflowers has higher population variance?
Standard Deviation
The standard deviation of a random variable, denoted \(\sigma\), is the square root of the variance, i.e.
\[\sigma(X) = \sqrt{\text{Var}(X)}.\]
Note that the standard deviation has the same units as the data. The variance of a random variable is also denoted by \(\sigma^2\).
Worked Examples
There are \(2\) bags, each containing balls numbered \(1\) through \(5\). From each bag, \(1\) ball is removed. What are the variance and standard deviation of the total of the two balls?
Let \(X\) be the random variable denoting the sum of these values. Then, the probability distribution of \(X\) is given as follows:
\[\begin{array} { | l | l | l | l | l | l | l | l | l | l l | } \hline x & 2 & 3 & 4 & 5 & 6 & 7 & 8 & 9 & 10 & \\ \hline P(X=x) & \frac{1}{25} & \frac{2}{25} & \frac{3}{25} & \frac{4}{25} & \frac{5}{25} & \frac{4}{25} & \frac{3}{25} & \frac{2}{25} & \frac{1}{25} & \\ \hline \end{array} \]
Previously, the expected value was calculated, \( E[X] = 6. \) As such,
\[ \begin{align} \text{Var}(X) =& E\big[(X - \mu)^2\big] \\ =& (2-6)^2 \times \frac{1}{25} + (3-6)^2 \times \frac{2}{25} + (4-6)^2 \times \frac{3}{25} \\ & + (5-6)^2 \times \frac{4}{25} + (6-6)^2 \times \frac{5}{25} + (7-6)^2 \times \frac{4}{25} \\ & + (8-6)^2 \times \frac{3}{25} + (9-6)^2 \times \frac{2}{25} + (10-6)^2 \times \frac{1}{25} \\ =& 4.
\end{align} \]Then the standard deviation is
\[\sigma(X) = \sqrt{4} = 2.\ _\square\]
\(3\) six-sided dice are rolled. What are the variance and standard deviation for the number of times a \(3\) is rolled?
Let \(Y\) be the random variable representing the number of times a \(3\) is rolled. The table below lists the probabilities of rolling different numbers of \(3\)s:
\[ \begin{array}{|c|cccc|} \hline \mbox{num 3s} & 0 & 1 & 2 & 3\\ \hline \mbox{probability } & \frac{125}{216} & \frac{75}{216} & \frac{15}{216} & \frac{1}{216}\\ \hline \end{array} \]
The expected number of times a \(3\) is rolled is \(\frac{1}{2}\), so \(E(Y) = \frac{1}{2}\). Now the goal is to calculate \(E(Y^2):\)
\[ E(Y^2) = \frac{0^2 \times 125 + 1^2 \times 75 + 2^2 \times 15 + 3^2 \times 1}{216} = \frac{144}{216} = \frac{2}{3}. \]
Therefore, \(\text{Var}(Y) = \frac{2}{3} - \left(\frac{1}{2}\right)^2 = \frac{5}{12}\) and \(\sigma(Y) = \sqrt{\frac{5}{12}}\). \(_\square\)
Consider the Bernoulli process of a sequence of independent coin flips for a coin with probability of heads \(p\). Let \(X_i\) be a random variable with \(X_i=1\) if the \(i^\text{th}\) flip is heads and \(X_i=0\) if the \(i^\text{th}\) flip is tails. Let \(Y\) be a random variable indicating the number of trials until the first flip of heads in the sequence of coin flips. What are the variance and standard deviation of \(Y?\)
In the Expected Value wiki, it was demonstrated that \(Y\) is a geometrically distributed random variable with \(E(Y) = \frac{1}{p}\). Then
\[ \text{Var}(Y) = E(Y^2) - \frac{1}{p^2},\]
where
\[ \begin{align} E(Y^2) & = 1 \cdot p + 2^2 (1-p) p + 3^2 (1-p)^2 p + 4^2 (1-p)^3 p + \cdots\\\\ &= p\big[1 + 4(1-p) + 9(1-p)^2 + 16(1-p)^3 + \cdots \big]. \end{align}\]
To compute this sum, consider the algebraic identity
\[ 1+ x + x^2 + x^3 + \cdots = \frac{1}{1-x}.\]
By first differentiating this equation, then multiplying throughout by \(x\), and then differentiating again,
\[ \begin{align} 1 + 2x + 3x^2 + \cdots &= \frac{1}{(1-x)^2}\\ x + 2x^2 + 3x^3 + \cdots &= \frac{x}{(1-x)^2}\\ 1 + 4x + 9x^2 + \cdots &= \frac{1+x}{(1-x)^3}. \end{align}\]
This implies
\[\begin{align} E(Y^2) &= p\frac{1+(1-p)}{\big(1-(1-p)\big)^3} \\ &= \frac{1+(1-p)}{p^2} \\ &= \frac{2-p}{p^2}\\ \\ \text{Var}(Y) &= E(Y^2) - \big(E(Y)\big)^2\\ &= \frac{2-p}{p^2} - \frac{1}{p^2} \\ &= \frac{1-p}{p^2} \\ \\ \sigma(Y) &= \sqrt{ \frac{1-p}{p^2} }. \ _\square \end{align}\]