Sine and Cosine Graphs
We started filling in parts of this page, but it is missing several details. Places with "???" would need to be edited.

If you draw a circle with radius 1, and have a ray extending from the origin and intersecting the circle, such that the ray makes an angle \( \theta \) with the \(x\)-axis, we can say that the point at which the circle is intersected by the ray is \((x, y)\). We can define \( \cos \theta \) as the \( x \) value of the coordinate and \( \sin \theta \) as the \(y \) value of the coordinate. Now that we have defined the basic trigonometric functions, we will consider properties of these functions by studying their graphs.
Contents
Sine and Cosine Graphs
In the graph of the sine function, the \(x\)-axis represents values of \(\theta\) and the \(y\)-axis represents values of \(\sin \theta\). For example, \(\sin 0=0,\) implying that the point \((0,0)\) is a point on the sine graph. If we plot the values of the sine function for a large number of angles \(\theta\), we see that the points form a curve called the sine curve:

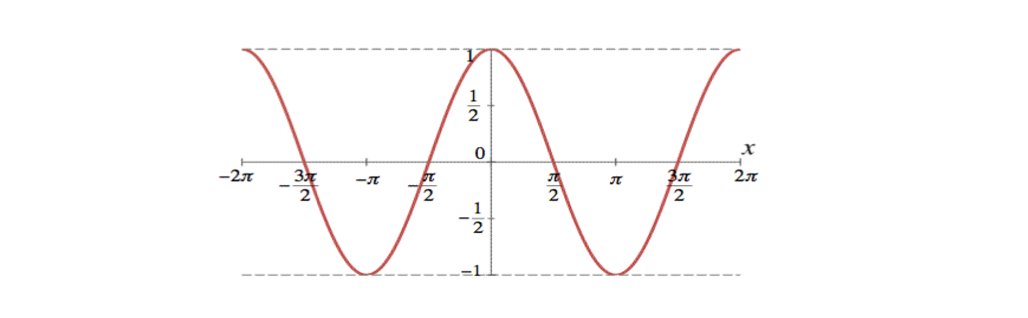
Similarly, plotting the values of the cosine function for a large number of angles forms a curve called the cosine curve:
We can visualize the relationship between these graphs and the definition of cosine and sine from the unit circle as follows:
 Animation courtesy commons.wikimedia.org
How many points of intersection are there between the graphs of \(\sin x\) and \(\cos x\) in the interval \([0, 2\pi]\)?
From the graphs of sine and cosine, it is evident that the number of intersection points in the given range is \(2\). \(_\square\)

Properties
The sine and cosine graphs both have range \( [-1,1]\) and repeat values every \(2\pi\) (called the amplitude and period). However, the graphs differ in other ways, such as intervals of increase and decrease. The following outlines properties of each graph:\[\]
Properties of Sine:
- \(y\)-intercept: \(0\)
- \(x\)-intercept: \( n \pi,\) where \(n\) is an integer here on
- increasing on intervals \(\left[\frac{(4n-1)\pi}{2},\frac{(4n+1)\pi}{2} \right]\)
- decreasing on intervals \(\left[\frac{(4n+1)\pi}{2},\frac{(4n+3)\pi}{2} \right]\)
- Symmetry: function is symmetric about the origin.
- Maximum of \(\sin \theta\) is achieved for \(\theta=\frac{(4n+1)\pi}{2}\).\[\]
Properties of Cosine:
- \(y\)-intercept: 1
- \(x\)-intercept: \( \left(n + \frac{1}{2} \right) \pi, \) where \(n\) is an integer here on
- increasing on intervals \(\left[(2n-1)\pi,2n\pi\right]\)
- decreasing on intervals \(\left[2n\pi,(2n+1)\pi \right]\)
- Symmetry: function is symmetric about the \(y\)-axis.
- Maximum of \(\cos \theta\) is achieved for \(\theta=2n\pi\).\[\]
Find all the \(x\)-intercepts for \(f(x) = 2\cos 3x +2 \) in the interval \(0\leq x\leq 2\pi \).
When the curve of \(f(x) \) intersects the \(x\)-axis, \(f(x) = 0 \). So \(2\cos 3x + 2 = 0 \Rightarrow \cos 3x = -1 \).
Since \(0 \leq x \leq 2\pi \Rightarrow 0\leq 3x \leq 6\pi \) and the cosine function has a period of \(2\pi\), we have \[3x = \pi, ~\pi+2\pi, ~\pi+4\pi \Rightarrow x=\frac{\pi}{3}, ~\pi, ~\frac{5\pi}{3},\] which are the three \(x\)-intercepts we are looking for. \(_\square\)
What is the number of intersection points between the two curves \(f(x) = 5\cos x + 7 \) and \(g(x) = -6\sin x - 10 \) in the interval \(0 \leq x \leq 2\pi\)?
Since both \(f(x) \) and \(g(x) \) are graphs that are a stretch and have a vertical shift, we first try to find whether there is a common intersection between these two curves.
Since \(-1 \leq \cos x \leq 1 \Rightarrow -5 \leq 5\cos x \leq 5 \Rightarrow 2 \leq 5\cos x + 7 \leq 12 \), the range of \(f(x) \) is \([2, 12]\).
Similarly, since \(-1 \leq -\sin x \leq 1 \Rightarrow -6\leq -6\sin x \leq 6 \Rightarrow -16 \leq -6\sin x -10 \leq -4 \), the range of \(g(x) \) is \([-16, -4]\).
Because \(f(x)\) is strictly positive and \(g(x) \) is strictly negative, there is no intersection point between these two curves. Specifically, there is no intersection point for these curves in the interval \( 0 \leq x \leq 2\pi. \ _\square \)
Relationship between Sine and Cosine graphs
The graph of sine has the same shape as the graph of cosine. Indeed, the graph of sine can be obtained by translating the graph of cosine by \(\frac{(4n+1)\pi}{2}\) units along the positive \(x\)-axis (\(n\) is an integer). Also, the graph of cosine can be obtained by translating the graph of Sine by \(\frac{(4n+1)\pi}{2}\) units along the negative \(x\)-axis. In other words:
\[\cos{\theta}=\sin{\left(\frac{(4n+1)\pi}{2}-\theta\right)}, ~\sin{\theta}=\cos{\left(\frac{(4n+1)\pi}{2}-\theta\right)}.\]
Simplify \( \sin \left( \frac{9 \pi }{ 2} - \theta \right) \).
Because the function \( \sin \theta \) has a period of \(2\pi\), \(\sin(-\theta) \) has a period of \(2\pi\) as well, so
\[ \sin\left(\frac{9\pi}2 -\theta\right) = \sin\left(\frac{9\pi}2 -\theta - 2\pi - 2\pi \right) = \sin\left(\frac{\pi}2 -\theta\right) = \cos \theta. \]
Alternatively, we recognize this as the form of \( \sin \left( \frac{(4n+1)\pi}{2} - \theta \right) \) with \( n = 2 \). Hence, it is equal to \( \cos \theta \). \(_\square\)
Simplify \( \cos \left ( \theta + \frac{\pi}{2} \right) \).
There are several approaches to use:
Using the properties listed above, we have
\[ \cos \left ( \theta + \frac{\pi}{2} \right) = \sin ( - \theta ) = - \sin \theta. \]Draw the graph, and compare it to what we already know.
By drawing the graph, we can visually see that it is equal to \( - \sin \theta \).Expand using the cosine - sum and difference formulas, which gives us
\[ \cos \left ( \theta + \frac{\pi}{2} \right) = \cos \theta \cos \frac{\pi}{2} - \sin \theta \sin \frac{\pi}{2} = - \sin \theta.\ _\square \]
Stretching and Moving
For complete information, see Graph Transformation.
We can manipulate the basic trigonometric graph by adding constants as follows:
\[y = a \sin (b x - c) + d.\] \[y = a \cos (b x - c) + d.\]
Let's consider how each of these constants changes the graph:
- Value \(a\) stretches the graph vertically.
- Value \(b\) contracts the graph horizontally
- Value \(c\) translates the graph horizontally
- Value \(d\) translates the graph vertically.
Find the amplitude, period, horizontal shift, and vertical shift of the function
\[ y = 2 \cos \left( \frac{\pi}{2} x - \pi \right) + 4.\]
So we want to find the values of \(a,b,c\) and \(d\) when we compare it to the form of \(a \cos(bx-c) + d \).
It's easy to see that \(a = 2, b = \frac\pi2, c =\pi, d = 4 \). Interpreting the values shows the following:
- The period of this function \(y = 2 \cos \left( \frac{\pi}{2} x - \pi \right) + 4 \) is \( 2\pi \div \frac{\pi}2 = 4 \).
- The amplitude is equals to the maximum absolute value of the scalar multiple of the trigonometric function. In this case, it is \( \left | 2 \cos \left( \frac{\pi}{2} x - \pi \right) \right | \leq 2 \).
- Since \(c = \pi\), the function has been shifted horizontally by \(\pi\) units to the right.
- Similarly, since \(d = 4\), the function has been shifted vertically by \(4\) units upwards. \(_\square \)
Given the function \[y = a \sin (b x - c) + d\] for constants \(a,b,c,\) and \(d\), what are the largest and smallest possible values of \(y?\)
Since \( -1 \leq \sin \theta \leq 1 \), it follows that \( -|a| \leq a \sin (bx -c) \leq |a| \). Thus, the largest possible value is \( |a| + d \) and the smallest possible value is \( - |a| + d \). \(_\square\)
Problem Solving
The position of a spring as a function of time is represented by an equation of the form \(p(t) = a \cos bt\). If the spring starts at 3 units above its rest point, bounces to 3 units below its rest point and then back to 3 units above its rest point in a total of 2 seconds, find an equation that represents this motion.
From the context "the spring starts at 3 units above its rest point," we can interpret it as \(p(0) = 3 \), which implies \(3 = a\cos(b\times0) \Rightarrow a = 3 \).
From the context "and then back to 3 units above its rest point in a total of 2 seconds," we can interpret it as the fundamental period of \(p(t) \) is \(2 \). So \(2 \pi \div b = 2 \Rightarrow b = \pi \).
Hence the equation that represent this motion is \(p(t) = 3 \cos \pi t.\ _\square \)